 Newton Leroy Gingrich, former Speaker of the House and failed 2012 presidential candidate, pretended to be “shocked” at the outcome of last week’s presidential election. He shouldn’t be, and he’s certainly smart enough to know that the outcome of this year’s titanic head-on collision on the train tracks of American elections wasn’t exactly hard to forecast. On one side, a lumbering steam locomotive hauling an ever-shrinking proportion of angry whites, and on the other side a bullet train of demographic change.
One of the best examples of this clash is right in Newt’s backyard: Gwinnett County, Georgia, which may in 2016 be the next Republican bastion to fall. Gwinnett, portions of which were in Newt’s Congressional District as he designed the 1994 Republican Revolution, was a viciously conservative white-flight suburb that voted for Ronald Reagan over Georgia’s own Jimmy Carter in 1980 and hasn’t voted for a Democrat since. In 1984, when Reagan was re-elected over Walter Mondale by 18 points nationwide, Gwinnett voted for Reagan by an astonishing 60 points.
But this year? As the vast majority of counties in the United States shifted more Republican compared to 2008, Gwinnett County went the opposite way. McCain carried Gwinnett in 2008 by 10 points, and Mitt Romney? Only 9. When compared to the national average, the slow collapse of the Republican margin in Gwinnett County is stunning:
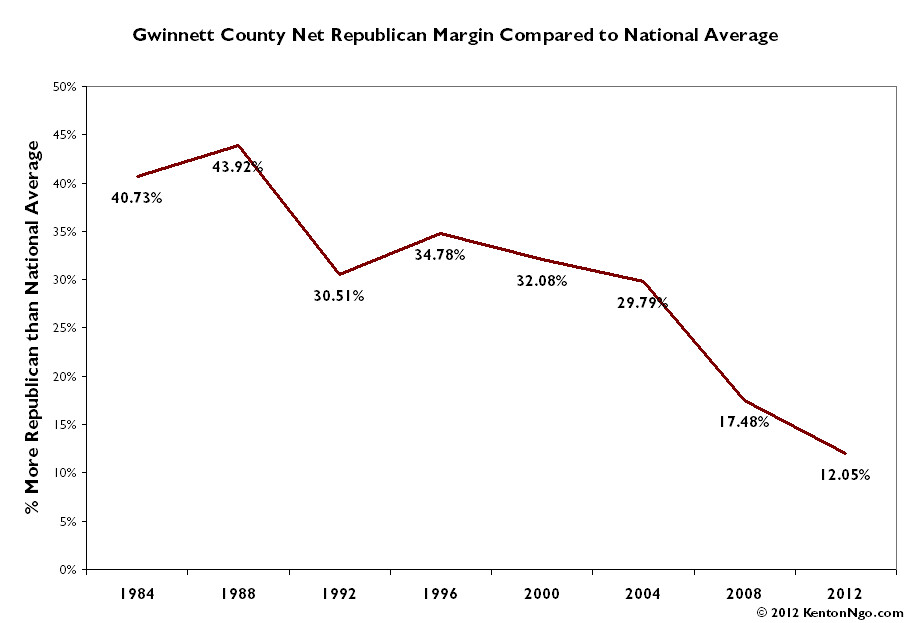
A county that in the 1980s gave Republicans a margin
over 40 points more than the national average is now only 12 points more Republican than average. So why the tortured train metaphor at the top of this post?
To understand how astonishing this transformation in Gwinnett is, one must first understand MARTA.
MARTA, the Metropolitan Atlanta Rapid Transit Authority, is Atlanta’s subway system: a valuable asset in a city so choked with traffic it is compared to the legendary congestion misery of Los Angeles and Washington, DC. MARTA is not nearly as effective as it could be, though, because it stops right at the Gwinnett County line. Why?

In 1971, Gwinnett County voters voted in a referendum to reject Gwinnett’s participation in MARTA. Car-owning suburbanites who had just left Atlanta itself feared trainloads of blacks pouring into their neighborhoods. The racially-charged nature of MARTA is still evident today: Urban Dictionary defines MARTA as “
Moving Africans Rapidly Through Atlanta.” It has been called the “Mother of All Mistakes” by frustrated Atlanta residents of today stuck in traffic. As this
Atlanta Magazine piece explains:
The 1965 and 1971 votes against MARTA by residents of Cobb, Clayton, and Gwinnett weren’t votes about transportation. They were referendums on race. Specifically, they were believed to be about keeping the races apart. Consider the suburbanites voting back then. The formerly rural, outlying counties had exploded with an astonishing exodus of white people fleeing the city as the black population swelled during the civil rights era. This mass migration came at a time when Atlanta was known through its public relations bluster as “The City Too Busy to Hate.”
Unfortunately for the angry whites, stopping MARTA didn’t keep the minorities out at all. A county that rejected rapid transit because it would have given blacks easy access to the suburbs is now, after the 2010 Census, majority-minority. In the last 10 years, the white-flight that gave rise to Gwinnett has come to Gwinnett: the white voting-age population actually fell. All of the population growth in Gwinnett County in the last 10 years? People of color.
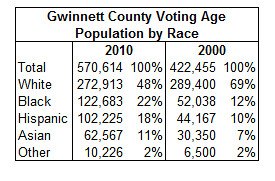
In this year’s 2012 presidential election, there simply were’t enough angry whites to toss President Barack Obama out of office. The flood of Hispanics and Asians swelling the ranks of suburban counties in Virginia and North Carolina delivered huge margins for President Obama. These votes, joined with an immovable black base, went head-to-head with the white voters of the Old Confederacy. In Virginia,
exit polls showed Obama won while carrying only 39% of the white vote. In North Carolina, Obama carried only 31% of the white vote, and came just short of winning: but as the share of minorities increases, underperformance among whites becomes less and less damaging.
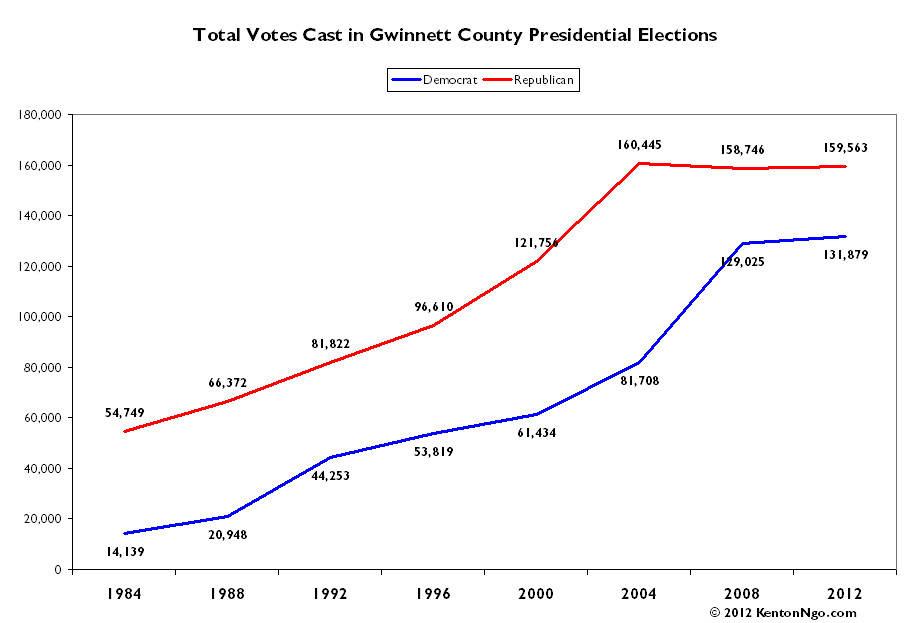
In Gwinnett, the stagnant and shrinking white population is evident in the raw number of votes cast for Republican candidates. After decades of explosive growth, the Republicans have reached a ceiling of 160,000 votes. The explosive growth of the minority population paid big dividends for Democrats in 2008, and held steady in 2012.
What’s even more amazing is that it didn’t have to be this way for the Republicans at all. Even if the black base is impenetrable, the growth in the Asian and Latino populations should not have been so devastating for them. The Asian and Latino populations were enticed by the Republican policies on social issues and taxation, and for some groups Cold War era resentments of being soft on Communism sent them into Republican arms. I would know. As a Chinese-American, I spent a few years of my childhood living in Norcoss in Gwinnett. At the time in the late 90s, the Asian population was starting to explode, and the Chinese filled the pews at the Chinese Bible Church of Greater Atlanta, and filled the farmer’s market every weekend. Nationwide, Asians voted for Bob Dole in 1996. No Republican has carried the Asian vote since, and Barack Obama won Asians with a crushing 73% of the vote.
As the white population of Gwinnett shrinks, and as the Black, Latino, and Asian population grows, the self-inflicted wounds that Republicans gave themselves have turned Democratic-trending minorities into a Democratic base. The simple black and white racial politics that delivered Newt Gingrich-style Southern Whites victories have been scrambled by yellow and brown. It won’t be long now before the county that rejected a train because whites drove cars becomes a diverse, Democratic bastion. The states of the Old South are falling one by one, roughly in order of the growth of their minority populations: first Florida, then Virginia, then North Carolina. It would warm my heart to see Georgia next.
Election data from the indispensable US Elections Atlas.
 It’s well-known by now that Barack Obama’s strong support among a growing set of people of color propelled him to victory over Mitt Romney’s white-dependent coalition. Few states have shown this more than Virginia, where exit polls show Obama won the state carrying only 37% of the white vote. I have prepared the map below which overlays polling place-level election results on top of Census non-white percentage.


 Newton Leroy Gingrich, former Speaker of the House and failed 2012 presidential candidate,


