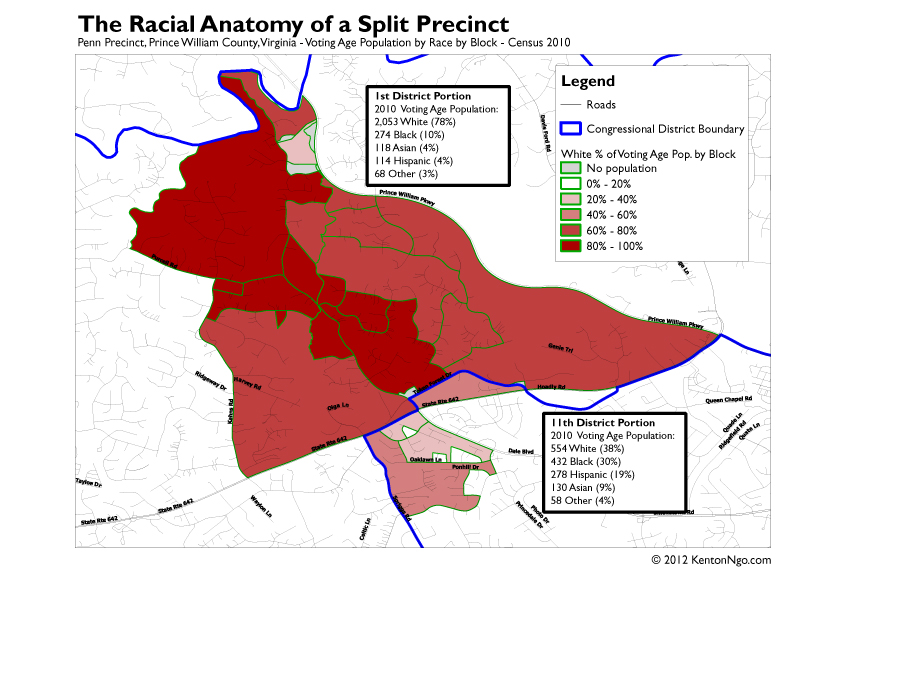
Gone are the days when redistricting consisted of markers and paper: now we know down to each and every block exactly how many white people over the age of 18 live there. In state like Virginia where white voters and minority voters are in total opposition, this matters.
I do still check on political blogs from the Commonwealth of Virginia, where I grew up. The eagle-eyed Not Larry Sabato blog was watching one particular precinct in Prince William County, Penn, which was split by Republican-controlled House of Delegates and Congressional redistrict, but left intact in the Democratic-controlled State Senate redistricting in 2011. What did this level of attention get them?
The bigger chunk of Penn, about 79% of it, was placed in the 1st Congressional (Rob Wittman) and 51st House of Delegates district (Rich Anderson), while the smaller chunk, about 21% of the precinct went with the 11th Congressional District (Gerry Connolly) 31st Delegate seat (Scott Lingamfelter). In the Congressional map, it was drawn to help all incumbents, so I knew the Connolly chunk was supposed to be more Democratic, while the Wittman area was supposed to be more Republican. In the House of Delegates districts, Republicans were trying to solidify Anderson who narrowly won his seat in 2009, so he got the more Republican area, while the Democratic area went into the much safer GOP seat of Lingamfelter that runs into other strongly GOP areas.
After reading all this, you must be wondering- how effective was this map? Here it is:
Rob Wittman/Rich Anderson portion of Penn precinct
Mitt Romney 1,028 (59.1%)
Barack Obama 710 (40.9%)Gerry Connolly/Scott Lingamfelter portion of Penn precinct
Mitt Romney 107 (26.4%)
Barack Obama 298 (73.6%)18.2% Romney margin of victory vs. a 47.2% Obama margin of victory
While political data is available down to the precinct level, the Census Bureau does count every single person by race block by block. In Penn, and other split precincts I saw in the 2011 redistricting cycle, the precincts were mostly split along obvious racial lines. All across Northern Virginia, whiter single-family homes were cleaved from less white townhouses and condos. While it’s certainly possible to link individual modeling scores block by block to attempt to calculate a precinct fragment’s lean, in a state as racially divided as Virginia it almost isn’t useful. Using this map of Penn precinct, I calculated the race population of each precinct fragment. Unsurprisingly, the variance in each fragment’s political performance matched up with race quite closely. This was one of many examples of redistricting deftly taking out minority blocks, not just precincts, and packing them together in super-blue districts.

In the north portion given to the 1st Congressional District that gave Romney 59%, the voting age population is an astonishing 78% white. In the south portion given to the 11th Congressional District that gave Obama 74%, the voting age population is only 38%! You may notice that the block lines don’t match up quite exactly with the precinct lines–precincts are not required to follow Census geography–but the data is close enough to conclude that at least in Penn, Republicans knew block by block what they were doing.

